From Sound to Score and Back
Approaches to composing with spectral data
One of the defining features of spectral music is a primary engagement with acoustic and psychoacoustic phenomena, articulated by Gérard Grisey as a desire for music that takes sound itself as a model for musical structure (Fineberg 2006, 105). The development of digital tools for signal analysis allowed composers to examine sonic events at an unprecedented level of detail, suggesting a wealth of new compositional directions informed by the physical properties of sounds. Spectral analysis data yielded by the Fast Fourier Transform (FFT) holds particular interest for spectral composers; although not necessarily a focus of spectral composers’ processes, reference to this information can allow composers to explore relationships between timbre and harmony in specific ways. The following discussion examines the compositional application of FFT data, first investigating the dynamics inherent in this practice, and then demonstrating how these issues have influenced the author’s compositional approaches.
Informing the compositional process using spectral analyses is a means to capture a measure of a source sound’s character, heard especially in the technique of instrumental re-synthesis (famously employed in Grisey’s Partiels). This technique is analogous to additive synthesis, employing acoustic instruments to mimic the frequencies and amplitudes of a source spectrum’s significant partials. The timbre generated by the ensemble will invariably differ from the original sound, primarily because each instrument produces its own unique spectrum and dynamic envelope. However, instrumental re-syntheses that draw frequency relationships from the acoustic properties of physical bodies can elicit striking hybrid timbres that blur the boundaries between the source and instrumental sonorities, in what Grisey refers to as “liminal” regions (Grisey 1991, 352).
In addition to such phenomenological aims, composers may use spectral techniques as a means of exploration, finding interesting harmonic structures within physical phenomena without necessarily aiming to imitate the source sound. While perceptual connections between newly composed materials and the source sound from which they are generated may be weak, harmonies drawn from acoustic spectra can be structured in unexpected ways, and may have uniquely cohesive qualities.
Beyond these perceptual concerns, the spectral approach is also attractive from a conceptual perspective; the idea that a sonic event may be seized, unravelled and spun into a piece of music is a poetic one, and appeals to the ideal of a music founded in nature. In this way, such a compositional process itself may participate in the web of meaning expressed by a piece.
Overview of a Spectral Compositional Process
The following discussion outlines a process of composing with spectral analysis data. While this process makes use of AudioSculpt and OpenMusic (developed at IRCAM), the concepts illustrated may be applied in a variety of software environments. I have incorporated this approach into the compositional processes for a number of my own compositions, modifying and building upon these techniques in a variety of ways. The essential method can be divided into three main stages: analysis of a source sound, pre-compositional data manipulation and application of these materials in a composition.
Spectral Analysis of Source Sound
Fast Fourier Transform

The principal tool of spectral analysis is the Fast Fourier Transform (FFT), which is a signal analysis algorithm that decomposes a signal into a set of sinusoidal components. An FFT analysis reveals the frequencies and amplitudes of the set of partials found within the source spectrum. 1[1. It also reveals their phases, however these data are not relevant in this context.] This method of signal analysis aligns well with the human perceptual apparatus: the cochlea and cilia in the inner ear similarly parse incoming signals into frequency components, so that with careful attention, a listener may be able to isolate many of the individual partials of a complex spectrum.
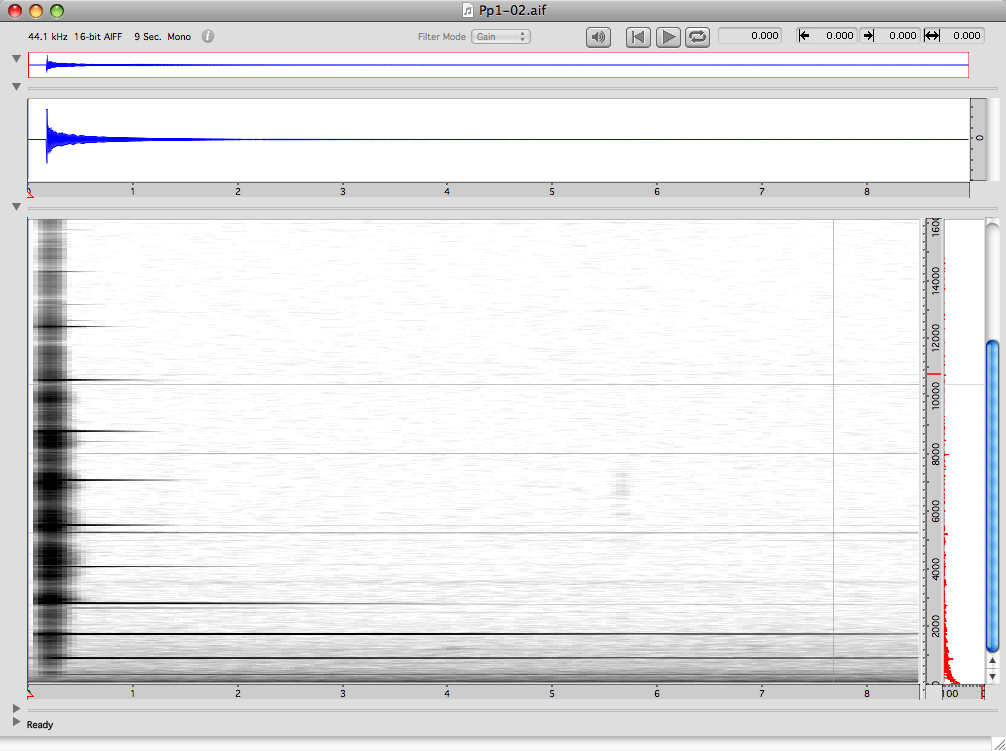
In the graphical representation of an FFT analysis of a metal pipe struck with a metal object (Fig. 1), time and frequency are represented on the x and y axes, and the amount of energy present at a given point is represented by the darkness of the pixel.
FFT analyses often produce an unwieldy volume of data, since a very large number of sinusoidal components may be required to accurately reproduce the complexities of a live recording. In order to determine which components will be of compositional use, I use a number of methods to distil the FFT data to a manageable quantity.
Tracking Analysis
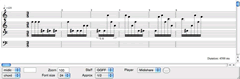
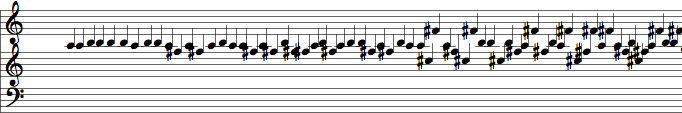
After performing an FFT analysis, a partial tracking analysis is applied to identify components that maintain a significant level of energy over a period of time. This process eliminates noise components, transients and very weak partials. The partial tracking data is then exported from AudioSculpt using the sdif file format, subsequently imported into an OpenMusic patch, and translated into staff notation. In the results of a partial tracking analysis of the FFT of the struck metal pipe (Video 1), each chord represents a frame of the FFT analysis, corresponding to a “slice” in time. Note that while frequency information is represented by pitch, the amplitudes of each note are not visible in this representation. However, amplitude data is retained as a MIDI velocity attached to each note.
Frame Selection
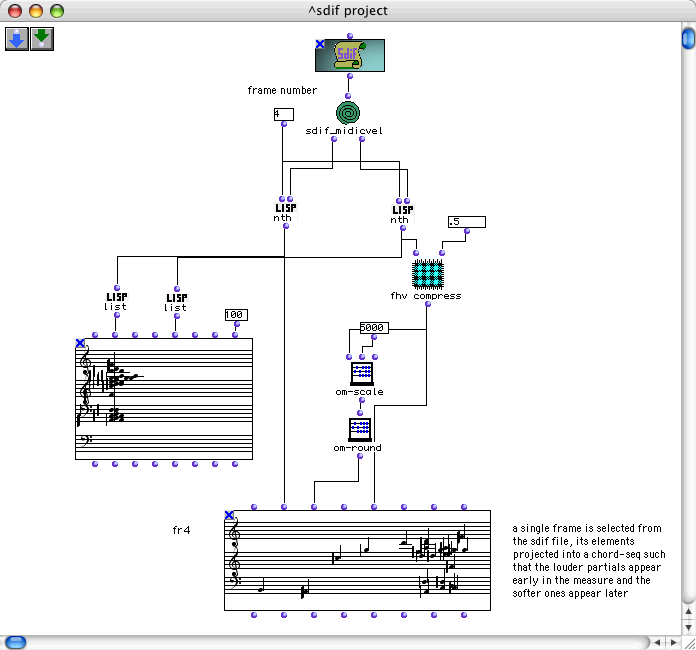
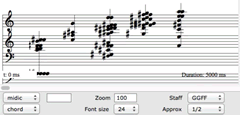
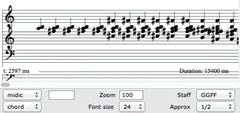
From the long series of chords produced by the partial tracking analysis, a particular chord may be selected for closer inspection. An OpenMusic patch (Fig. 2) allows the user to isolate a chord from the sequence, and project its elements in space, such that the lateral position of the note is proportional to its amplitude: stronger pitches appear to the left, weaker pitches to the right.
Pre-Compositional Data Manipulation
Filtering by Partial Strength
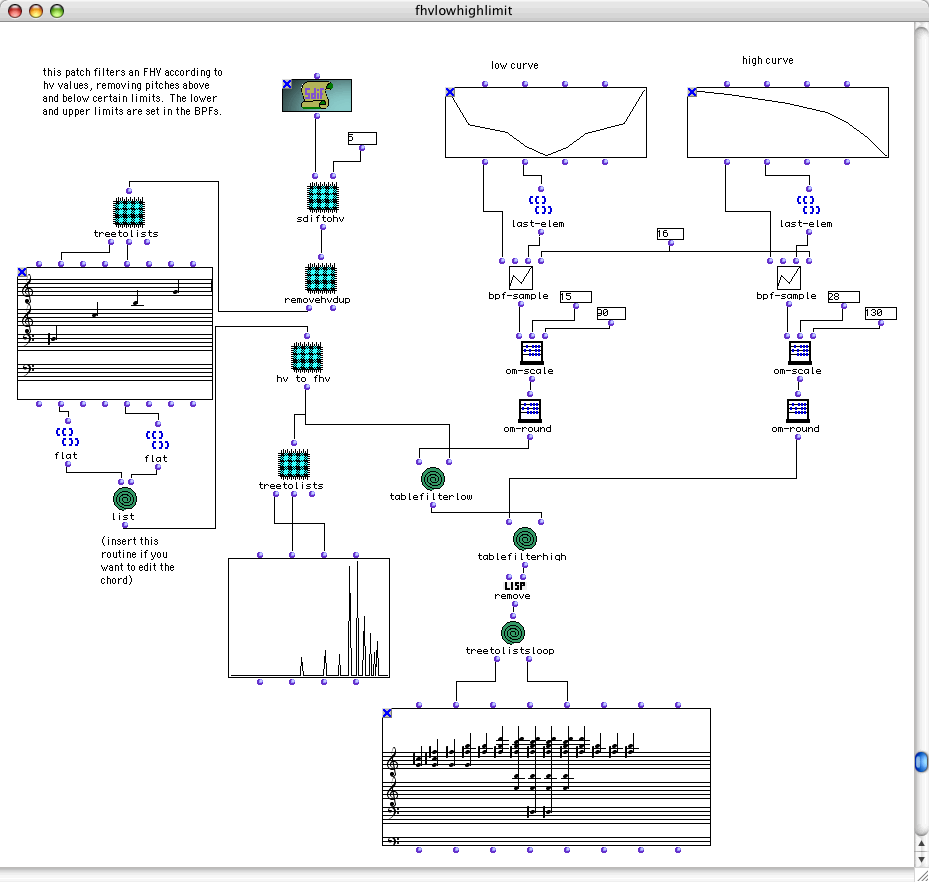
A chord selected from a partial tracking sequence is then brought into other patches for filtering and manipulation. Figure 3 depicts a patch that repeats a given chord a certain number of times and filters this chord sequence according to partial strength. The curves in the upper right corner of the patch define the upper and lower boundaries of the filter.
By filtering a spectral harmony according to the partial strength, we find that a continuum emerges between pitch perceptibility and timbral mimesis. On one end, only the most prominent partials are represented, these being the components that a listener would most likely be able to isolate aurally. 2[2. Strictly speaking, amplitude is not the only determinant of perceptibility, since other psychoacoustic factors come into play depending on the frequency relationships among partials. However, these factors play a minimal role in this context.] On the other end, the inclusion of the weaker partials produces a rich spectrum with a stronger timbral identity. These subtle components are difficult to isolate aurally, yet nevertheless make important contributions to the identity of the source sound — the more inclusive the spectrum, the more faithful the re-construction will be to the original sound. By dynamically controlling a spectrum’s depth of analysis, the composer is able to navigate along this continuum, while at the same time controlling the complexity of the material to fit the musical context.
The example in Video 2 illustrates motion along this continuum. All but the strongest partials have been removed from the first chord; as the sequence progresses, the lower limit of the filter descends until all components are present in the last chord. This passage may be heard to effect a transition from the clear articulation of the spectrum’s most audible pitches to a complex composite harmony imbued with the timbral quality of the source sound.
In addition to allowing the composer to control pitch density and create transitions from focal pitches to complex textures, I view this transition as a stochastic expression of the spectrum, whereby stronger partials are more prevalent in a given passage than weaker ones. Partial prominence is thus heard as persistence through time, rather than only as amplitude relationships.
Melodic Projection
Another set of patches applies a probabilistic expression of partial hierarchies to each chord within a sequence, yielding stochastic textures similar to those described above. In the resulting melodic projections, the probability of a pitch occurring at a given time point is proportional to its hierarchy within the spectrum (Video 3).
Application: Elucide
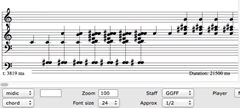
The process described above was applied during the composition of Elucide (2006), for chamber orchestra. A series of chords were derived from piano, crotale and singing bowl spectra (Video 4). These were selected so that prominent partials are maintained between successive chords, allowing for smooth amplitude interpolations (Video 5). This sequence was then projected into a melodic texture (Video 6), which provided the pre-compositional material that was used to compose a section of the work for chamber orchestra (Video 7).
Application: Synesthesia
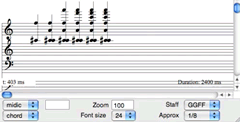
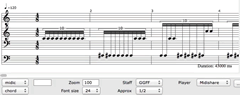
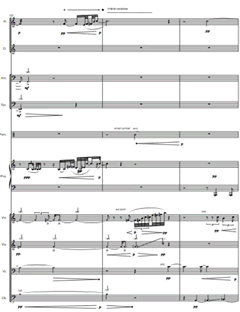
Another application of this approach was used in Synesthesia (2013), for tablet-controlled electronics. A chord sequence (Video 8) was generated by using frequency interpolation between two portions of a metal bowl spectrum, with amplitude filtering applied to the beginning and end of the passage. This sequence was projected to create an audio passage (Fig. 4 / Audio 2). As before, pitch onsets are determined stochastically; additionally, the durations of each note are scaled relative to that element’s amplitude (note durations are not represented in the score). The final note sequence is performed using a synthesizer patch in Max (Audio 2).
Conclusion
The preceding discussion has aimed to elucidate some of the issues that are inherent in composing with spectral data, and to illustrate some specific techniques that I have employed in my own compositions. The process described above provides a means to parse, filter and examine FFT data in order to obtain a manageable and relevant spectral representation. As well, by dynamically controlling the depth of analysis, the perceptual characteristics of a spectral harmony may be flexibly explored. Finally, while the described technique of projecting spectral chords into stochastic textures is an idiosyncratic one, it offers an approach to the issue of applying spectral data in a way that represents both frequency and amplitude information.
Bibliography
Fineberg, Joshua. “Guide to the Basic Concepts and Techniques of Spectral Music.” Contemporary Music Review 19/2 (2000) “Music: Techniques, Aesthetics and Music,” pp. 81–113.
_____. “Spectral Music.” Contemporary Music Review 19/2 (2000) “Music: Techniques, Aesthetics and Music,” pp. 1–5.
_____. Classical Music, Why Bother? Hearing the World of Contemporary Culture through a Composer’s Ears. Routledge, 2006.
Grisey, Gérard. Partiels (1975), pour 18 musiciens. Score. Ricordi (Milano), 1976.
_____. “Structuration des timbres dans la musique instrumentale.” In Le timbre: métaphore pour la composition. Edited by Christian Bourgois. Paris: IRCAM, 1991.
_____. “Did You Say Spectral?” Contemporary Music Review 19/3 (2000) “Music: Techniques, Aesthetics and Music,” pp. 1–4. Translated by Joshua Fineberg.
Litke, David. “Elucide for Chamber Orchestra.” Unpublished DMA Dissertation, University of British Columbia, 2008.
Social top